Debug Window
Omni-bot Debug Window
The Debug Window is primarily a debugging and informational aid for Omni-bot. When enabled, it spawns an OpenGL powered window along side the game, and is primarily used when you are running the game in windowed mode. It provides an interface to look at the bots state tree, a script console, a map, log, profiler, and eventually it will be exposed to scripts so that scripted tools or utility information can be displayed to it as well.
The previous debug window was powered by FLTK, and while it is a good toolkit for GUI applications, it isn't meant to be refreshed and redrawn as much as I needed it to be, and as a result incurred a high cost of updating each frame. Now, by being OpenGL powered, it can take advantage of the inherent speed of hardware acceleration and eventually some 3d elements if needed, all while staying cheap to process and render.
The debug window is now powered by OpenGL, guichan, and SFML
Installation
First of all rename or backup file omnibot_et.dll in the omni-bot folder.
Download files dw_enabled/omnibot_et.dll and gui/default_font.bmp from Assembla SVN repository. Then copy omnibot_et.dll from dw_enabled folder and overwrite file in parent folder.
Start game in window mode (fullscreen will not work), load any map and then use console command /bot dwon.
Note: If you use ET:Legacy and have problem with mouse clicks, try to change cvar in_mouse.
Note: Linux is not supported.
Note for developers: If you compile Omni-Bot from C++ source code, you must uncomment line #define ENABLE_DEBUG_WINDOW in file common.h. You must also enable build of 3rdParty dependencies detours, guichan, iprofs.
Windows
Console
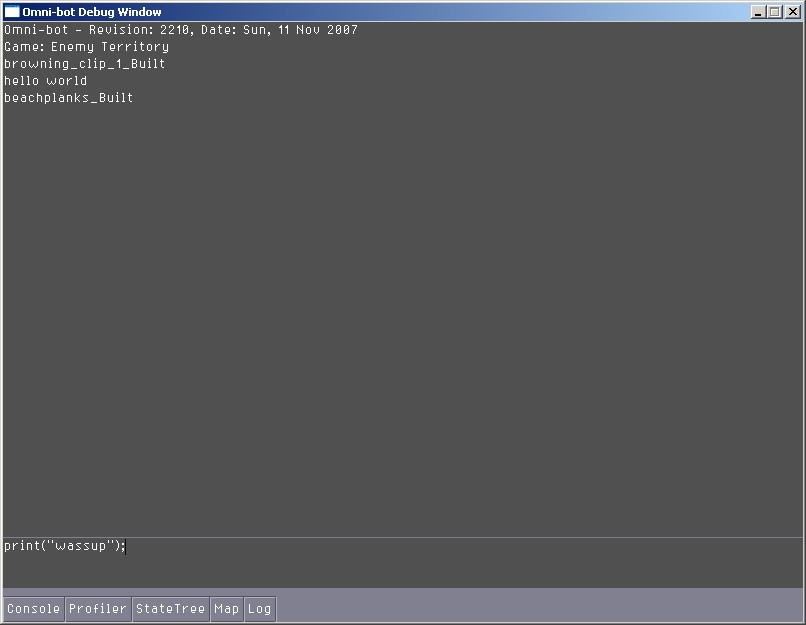
For the scripting users among us, the console window provides an interface directly into the scripting system, and allows you to execute script commands from a simple input window and see outputs such as print or error messages in the large box above.
Map
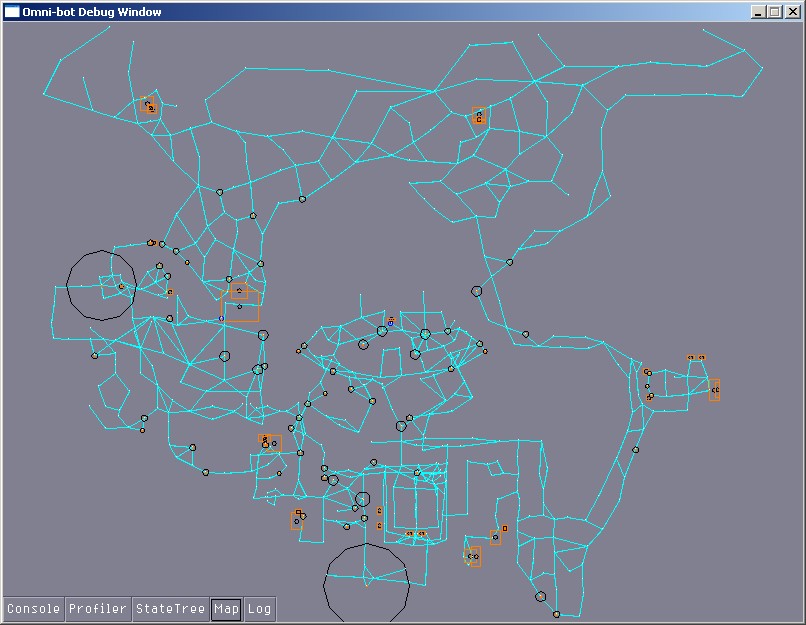
The map shows a number of useful things about the bots navigation, goals, pathing, etc.
- Waypoints(and their radius) and links
- Goal bounding boxes
- Current bot paths
- All entities
- Mouse wheel to zoom in/out
- Click drag to scroll
- Also planning to be able to mouse over entities to get additional information
Profiler
The profiler is also of course making a return. For anyone that has used it before, it allows you to peek around in the bot to examine the performance characteristics
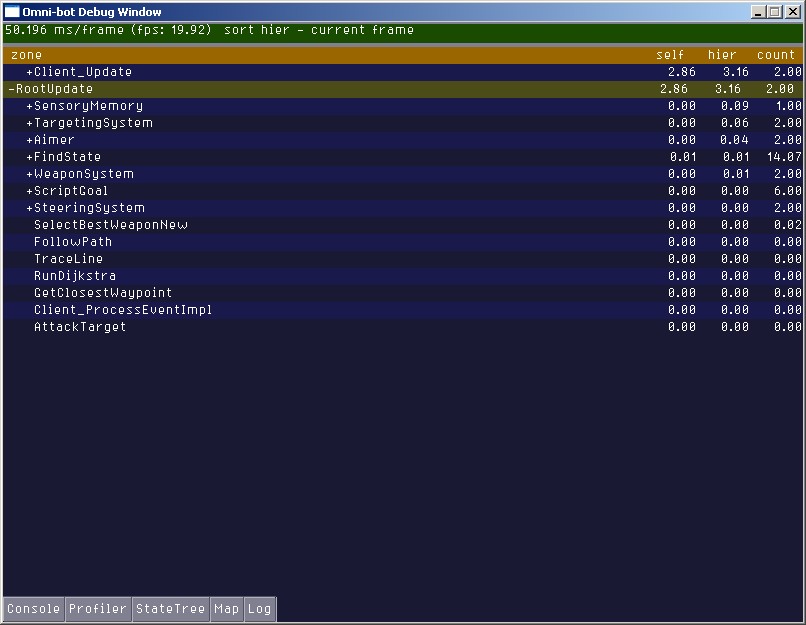
This shows the profiler information at the state machine updating level.
State Tree
One of the most useful tools available is the state tree. The state tree gives you a complete view of what is going on in the bots 'head'. You can see from the state tree all the behaviors that are running on the bot at any given time, and also can access additional information for specific states here as well. Scripted goals will also show up in this state tree as well.
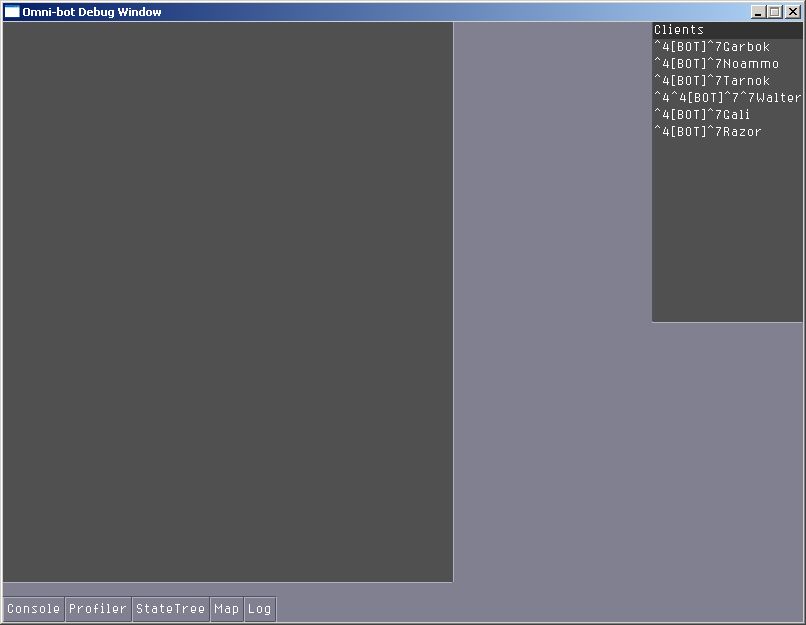
Nothing special about this. This is what you'll see before you actually click on a bot name in the client list to the upper right.
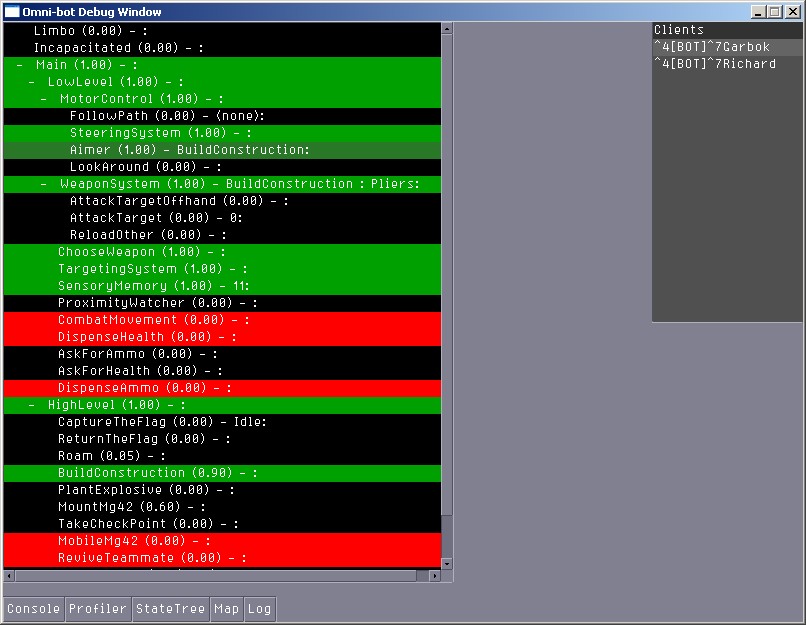
This shows the state tree for an ET bot. Some things to note about the state tree.
- Indentation shows hierarchy.
- Green lines are states that are currently running.
- Red lines are states that can't run because they don't meet a state requirement.
- Left click to show the states extra info, as shown below.
- Middle mouse click on state lines to enable their debug rendering if available.
- Right click on states to expand/collapse their children states.
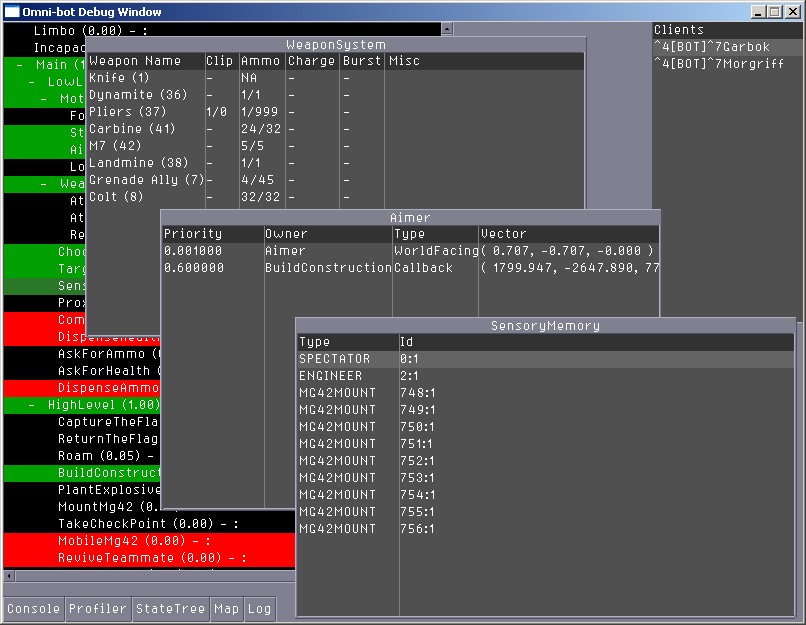
Many states will have additional information they can display specific to the state. This screen shows the windows for 3 states open, to give you an idea of what information the states are responsible for looking at.
In this case, the weapon system tracks a list of the bots current weapons, and information about it. The SensoryMemory is the bots eyes and ears, and will show the current perception information about all known game entities. The Aimer state is responsible for prioritizing a list of aim requests from other states and preventing multiple states from fighting over control of the bots aim.